Product Introduction
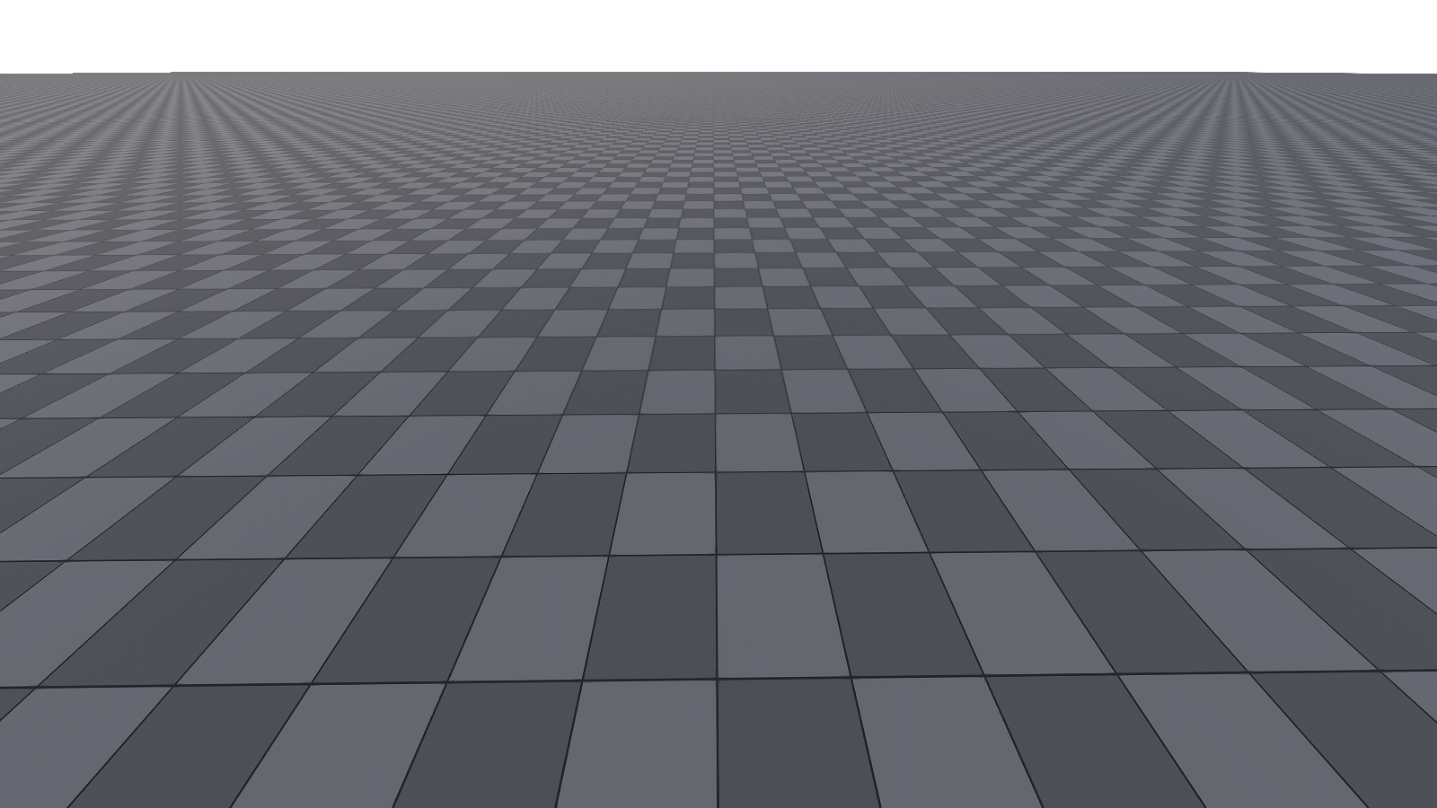
X Insight is a 3D integrated performance testing tool based on X 3D equipment. It is mainly able to quickly build, display, and analyze the performance of super-large content in large-scale scenarios. Load data with one click, process display, and analyze performance. The overall diagram is as follows:
Hardware Environment
| Device model | Parameter Requirements |
| CPU | Intel i5 or faster |
| RAM | 8GB or more , 16GB recommended |
| GPU | NVIDIA GeForce GTX 960 or faster |
Software Environment
- Windows 7 SP1 or above (requires graphics driver to support OpenGL4.5 or above or DirectX11)
- Linux Ubuntu 13.10 or above / Neokylin 5.0 or above
Precautions
- The core of the hardware-related requirements is that the GPU driver supports DirectX11 or OpenGL4.4 or above
Main Features
The current main features are as follows
- Cross-platform support, support Windows, Mac, Linux
- Supports creating objects with custom vertex information. Basic primitives include: prototype, sphere, triangle, etc.
- Support importing FBX model data
- Support importing CAD model data
- Support for importing point cloud (E57) data
- Support scene effect display and performance analysis at the level of 10,000 test units
- Support stress test scenarios and results, screenshot generation. (supports transparent layers)
- Supports video recording and display of stress test results
- Support environment correction, including sun position, scene floor, floodlight, fog and other effects
- Support line style debugging mode such as triangle line surface
- Support various debugging texture specific analysis in the rendering process
- Support various memory, CPU, GPU, stack information, physical system performance, triangle vertices, DrawCall and other information based on the built-in performance optimizer
- Different rendering links, function-level performance checking tools (only supported in Debug version). Used to accurately check performance consumption bottlenecks.
Development Tool Support
- Visual Studio 2015
- QT 5.14.0
- Xcode
- Gcc
Specific Steps
Import FBX model
Open the program, select the FBX file to import, if it does not exist, please manually copy the FBX file you want to test to the data directory of the program (any location is fine)
Click [Add FBX], wait a moment, and your FBX model will be displayed in the scene. The operation is as follows:
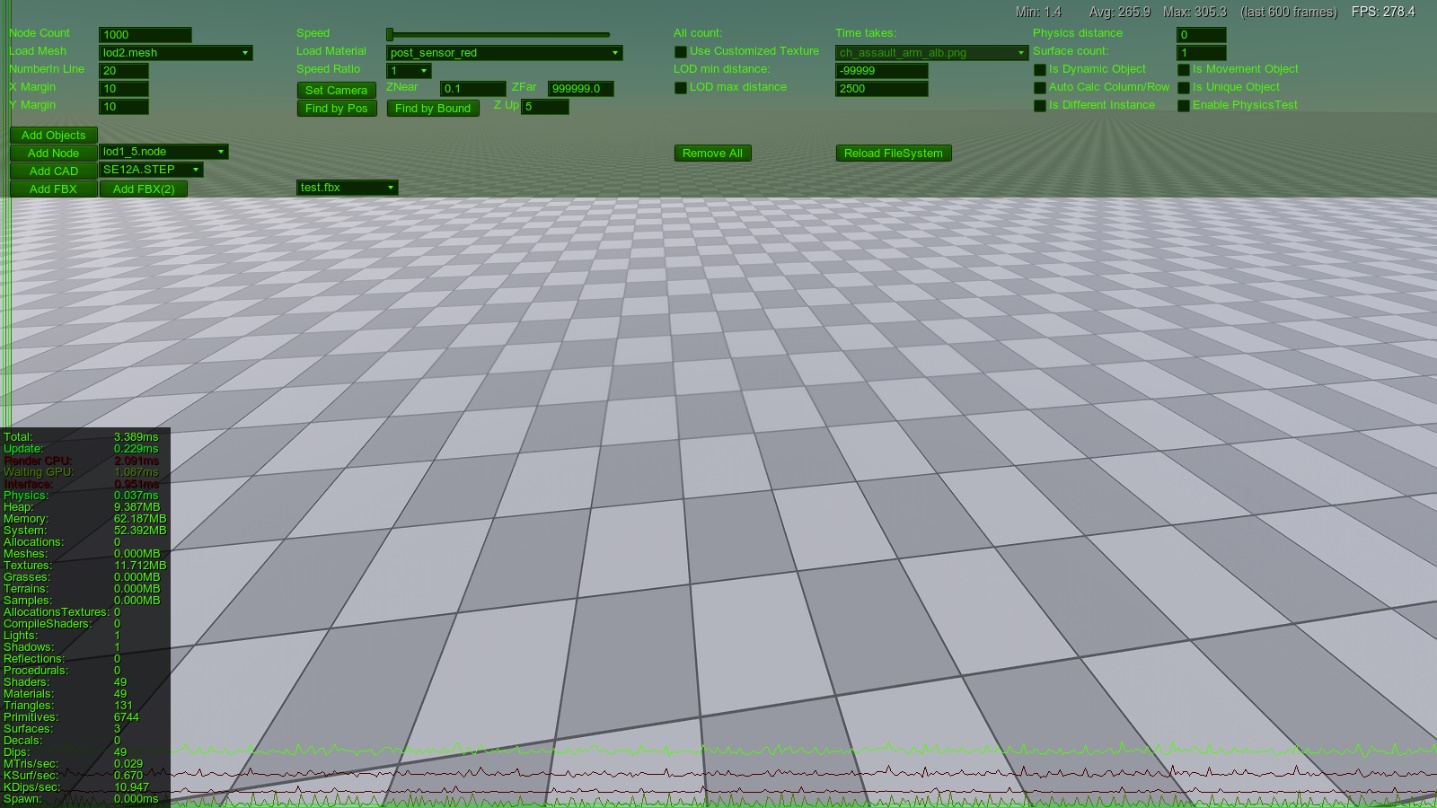
The effect after importing is as follows:
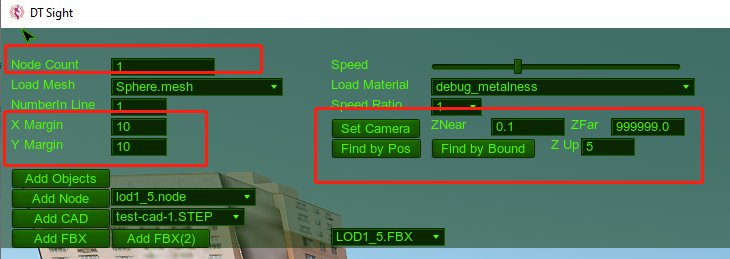
Other important configuration parameters:
- The number added to the scene: Node Count in the figure below
- X , Y margin , are the numbers of X and Y of multiple queues respectively (several rows and columns)
- Set Camera, because the initial position of many models is not necessarily standardized, many need to adjust some properties of the camera to see the effect. So please set the appropriate Z Near and Z Far at this time
- Find by pos / bound , this is the same reason as above, the position of the initially imported model has its own deviation, click these two buttons, you can get the current real initial position of the model, or the center position determined by the boundary.
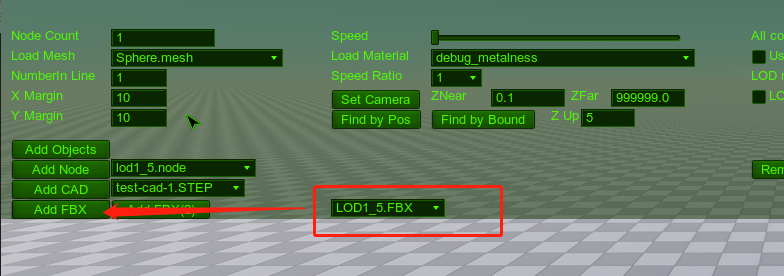
Import CAD objects
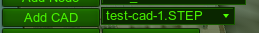
The method of importing CAD is the same as importing FBX, the only difference is that please select the CAD file and UI content. As shown below
Please note that since the CAD format is a different format than FBX, the import may fail, please contact us.
At the same time, after the CAD data is imported, known reasons will cause additional crashes when closing the program, but it does not affect the use. This problem is more complicated, please wait for our subsequent version to fix it.
Import custom Element
If there are supporting artists, it is the most convenient way to help you make Element in the editor directly. Copy the node file directly to the data directory of the program, and then you can choose to use it in the program

Since Element is a built-in object, there is no import step, and the loading speed will be very fast.
Scene Reset
In the interface, click [remove all], and the content in all scenes will be cleared.
Click [Reload FileSystem], the loaded file system will be reset.
DF engine built-in object addition
Add cloud object
Add seawater object
Video Recording
After entering the program, when you want to record the content of the current visible window to the video, press F10, and the console window will prompt to start recording the video. . . . , when you want to stop recording at any time, press F11
Finally, the recorded video will be stored in the Bin/videorecord directory of the program in the form of a file. The video format is mp4
In the future, we will provide a way to stream the video in real time.
Windows Screenshot
Provide 3 different levels of screenshots, corresponding to the shortcut keys F6, F7, and F8. The format is PNG, and the save directory is under the bin/screenshots directory where the program runs
F6 screenshot non-test interface and pure window content of performance analyzer, as shown below
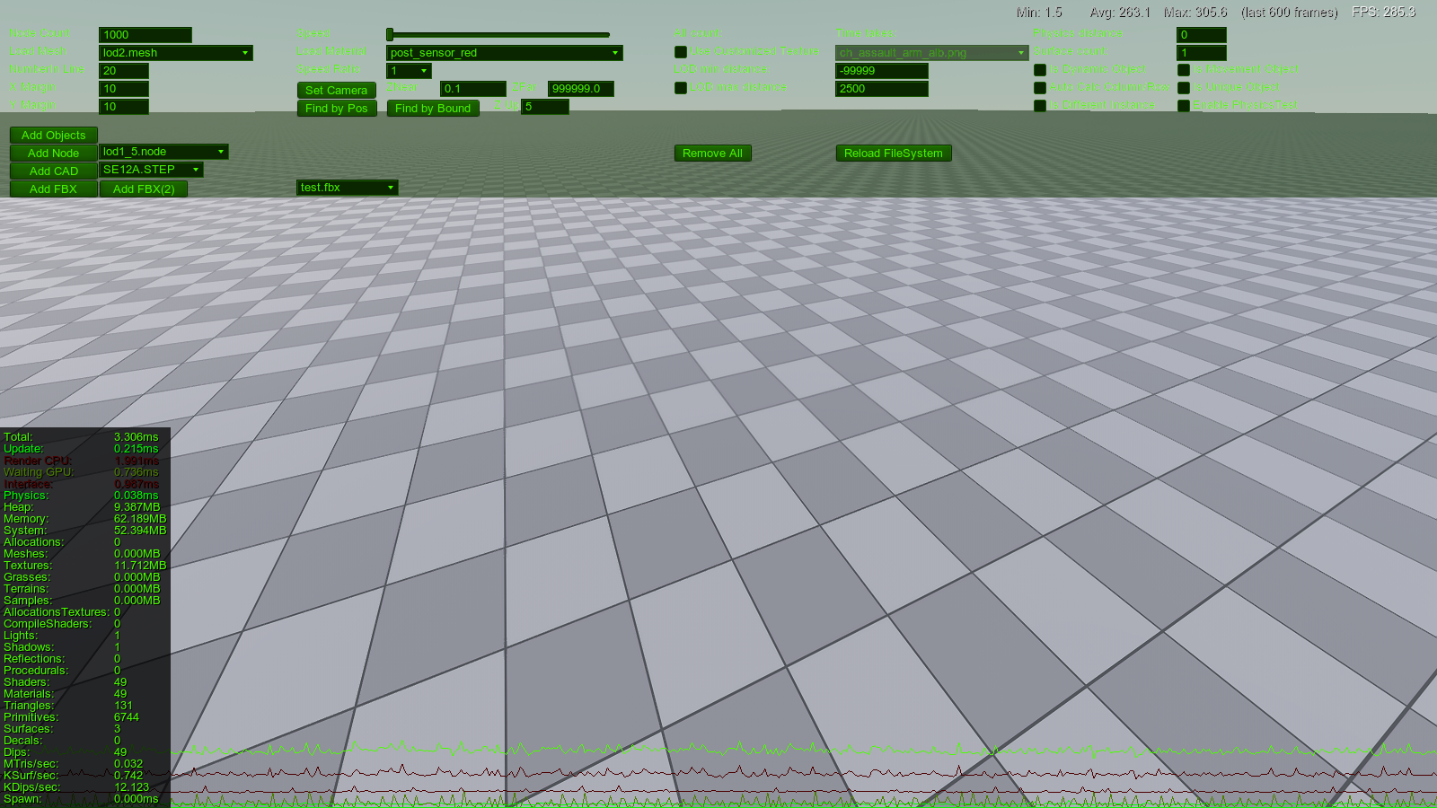
F7 screenshots all window content, excluding transparent channels, as shown below
F8 screenshots all window content, including transparent channels, as shown below
Performance Analysis
By default, DF Insight has turned on the performance analyzer, and you can see every detail in real time.
(Ctrl+S can be used to control display/hide)
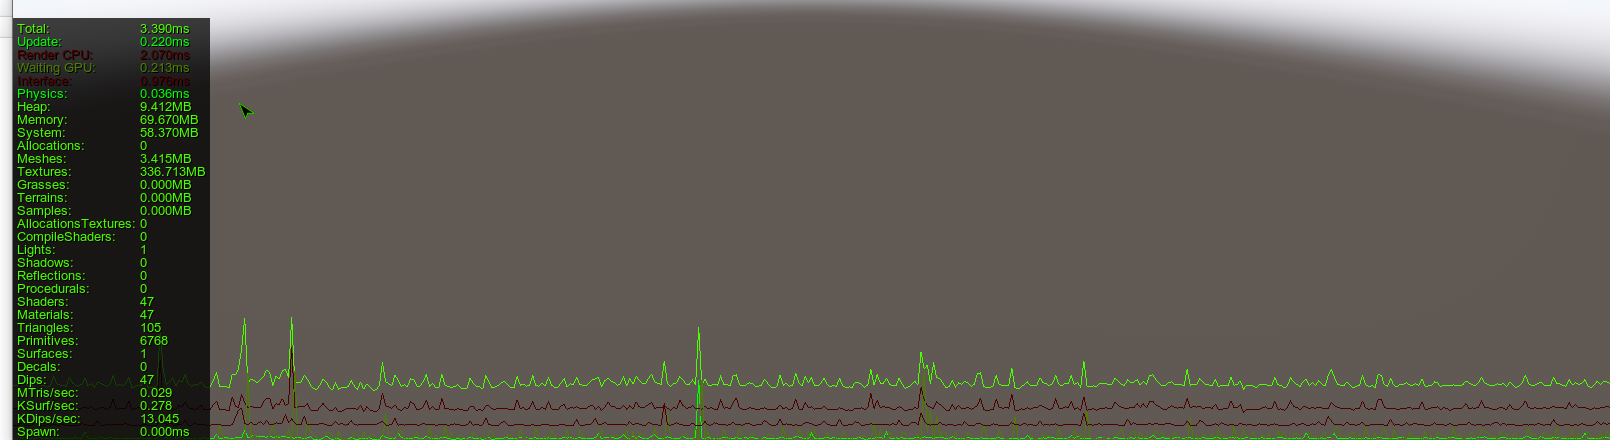
The specific contents are:
Total overall consumption time
Update Update time period consumption time
Render CPU CPU consumption time during rendering time
Waiting GPU rendering time period GPU consumption time
Physics physics system consumes time
Heap heap allocation memory situation
Memory memory allocation usage
System memory usage consumed by the system
Textures texture allocation memory usage
Grasses grass object memory consumption
Terrains terrain object memory consumption
Samples texture sampling object memory consumption
The number of light objects in the Lights scene
Number of shaders loaded in the Shaders scene
The number of materials loaded in the Materials scene
Traiangles The number of triangular drawing faces within the current visible range
Primitives The number of basic primitives in the current visible range
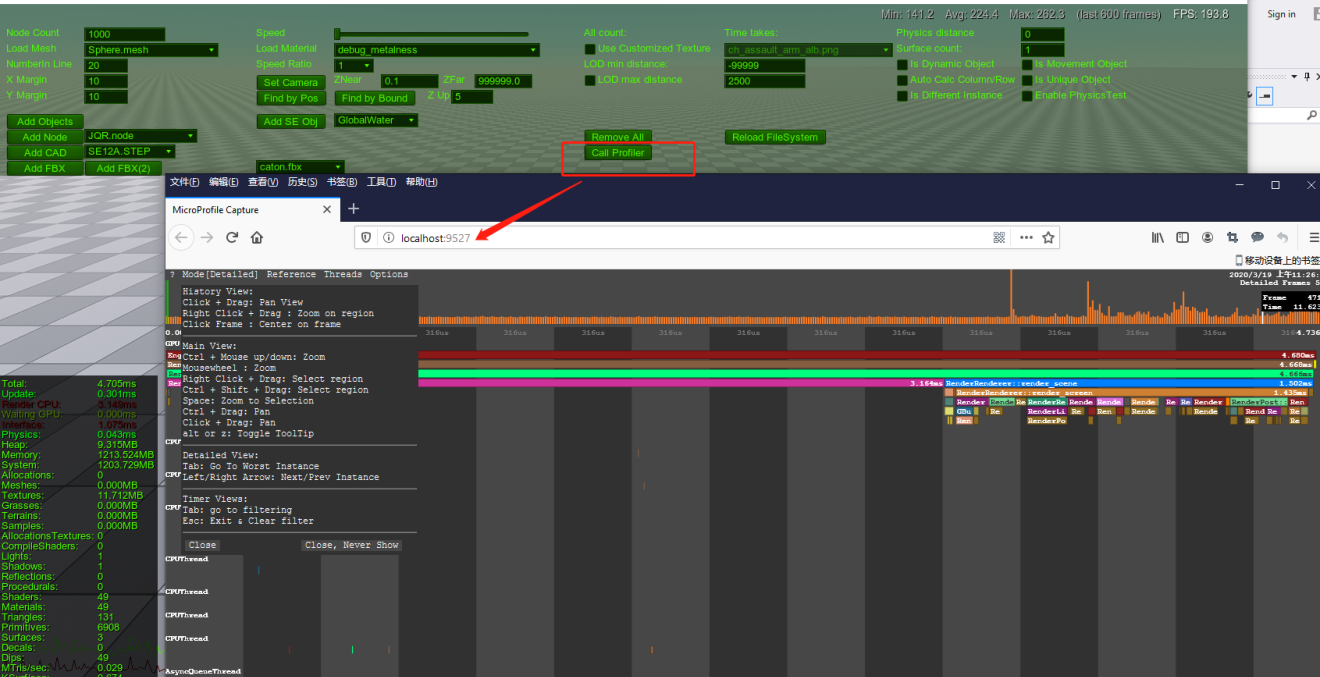
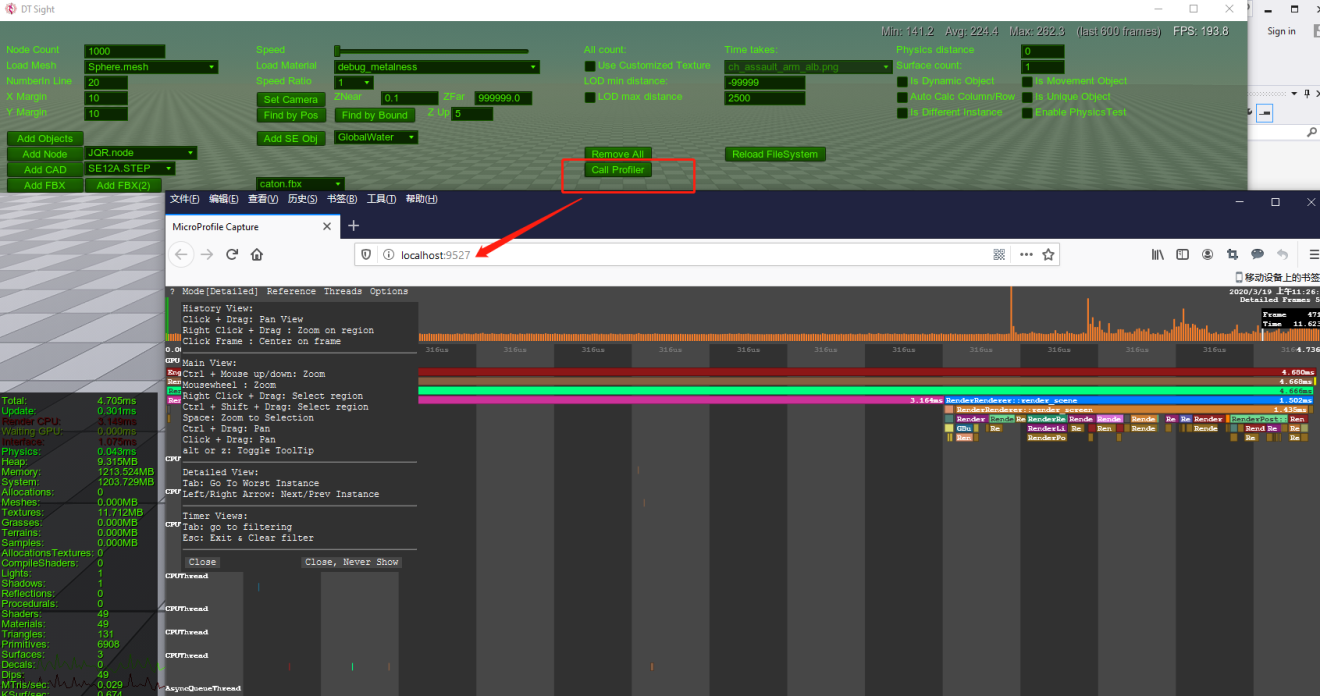
For more detailed function-level rendering of each rendering link, microprofile can be used, and the effect is as shown in the figure below.
Click the Call Profile button to call it out.
Hot Key
Control related:
Ctrl+1 Show/hide the upper control panel Ctrl+2 Show/hide the rendering-related control panel
Ctrl+s show/hide performance optimizer shown below
Screenshot related:
F6 screenshots non-test interface and pure window content of performance analyzer
F7 screenshots all window content, excluding transparent channel
F8 screenshots all window content, including transparent channel
Video recording related:
F9 starts recording screen video, excluding performance analyzer and interface elements (the video is in MP4 format, stored in the bin/videorecord directory)
F10 starts to record the video of all content on the screen (the video is in MP4 format, and the storage location is under the bin/videorecord directory)
F11 stops recording video